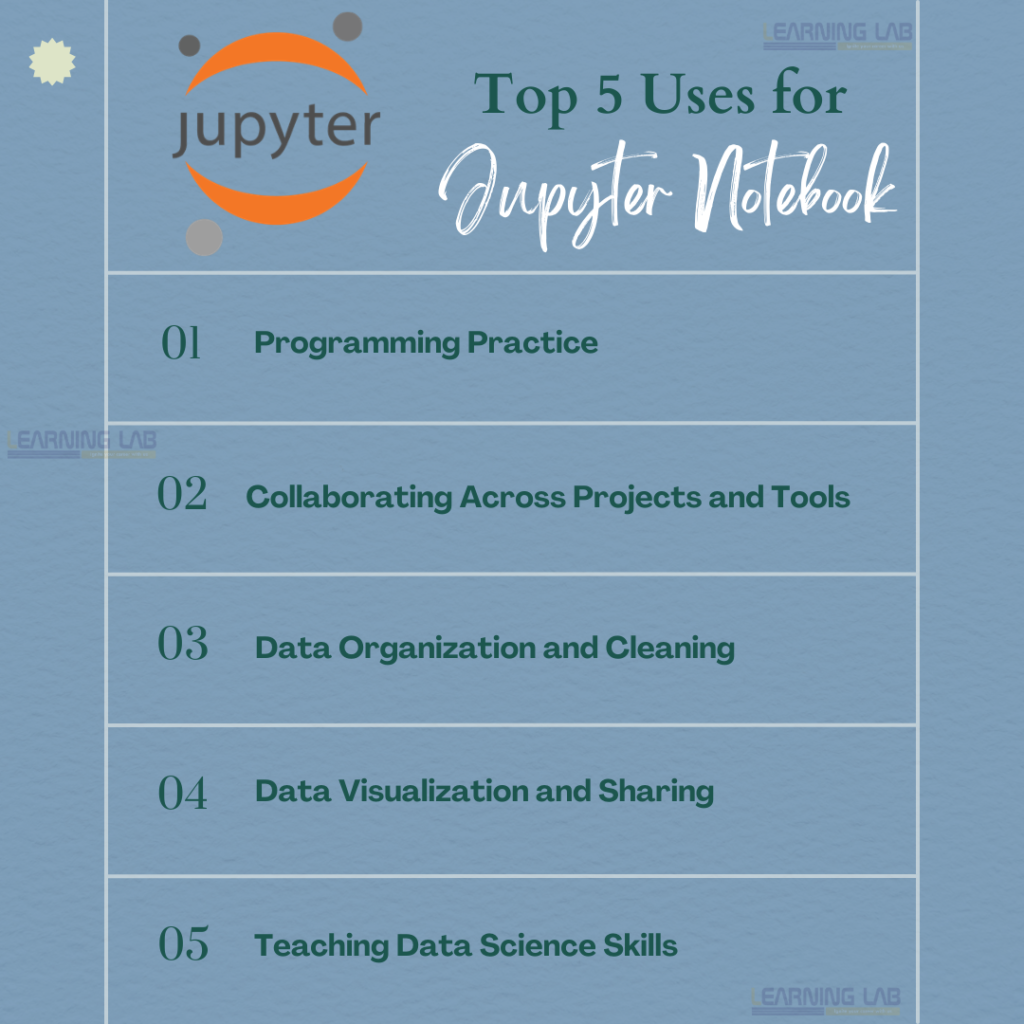
Jupyter Notebook R and Python: Jupyter Notebook is one of the most powerful tools in the realm of data science and data analytics. This versatile platform supports various programming languages, including R and Python.
With Jupyter Notebook being one of the most useful tools, it is only about time that we look more into the same – especially from the perspective of R and Python. So, let’s check out advantages of using R and Python in Jupyter Notebook, how to leverage it for data visualization with R and Python, and how to efficiently share variables between R and Python in Jupyter Notebook.
This article contains the following:
- Jupyter Notebook R And Python
- Advantages Of Using R And Python In Jupyter
- Data Visualization With R And Python In Jupyter
- Sharing Variables Between R And Python In Jupyter
Jupyter Notebook R and Python: Advantages of using R and Python in Jupyter
Jupyter Notebook is a preferred tool for both R and Python users due to its flexibility, interactivity, and seamless integration with data science libraries. Here are some reasons why using R and Python in Jupyter Notebook can be beneficial:
1. Interactive coding: Jupyter Notebook allows users to write code, execute it, and view the output in real-time. This interactivity enhances the coding experience, especially when working with data, models, and complex algorithms in both R and Python.
2. Integrated data science ecosystem: Jupyter supports numerous data science libraries like Pandas, NumPy, ggplot2, and dplyr. With Jupyter, you can seamlessly switch between R and Python to take advantage of the best libraries available in both languages.
3. Combining the strengths of two languages: The advantage of using R and Python in Jupyter Notebook is that it allows you to leverage the specific strengths of each language. While Python excels in general programming and machine learning, R is known for its statistical analysis and visualization capabilities.
4. Proper documentation: Jupyter’s format allows you to write documentation alongside your code using Markdown. This feature makes it easier to share your workflows, whether for educational purposes or collaboration in research projects. This is particularly useful when working with both R and Python in Jupyter Notebook.

Data Visualization with R and Python in Jupyter Notebook
Data visualization with R and Python in Jupyter makes the analysis process clearer, more insightful, and more accessible. Jupyter’s flexibility allows you to generate visualizations using the best libraries from both programming languages.
R and Python each have their own set of powerful visualization libraries that can be used within Jupyter Notebook:
- R libraries: ggplot2, plotly, and lattice
- Python libraries: Matplotlib, Seaborn, and Plotly
By using these libraries, users can create a wide range of visualizations, from simple plots to complex interactive graphs. The ability to use both R and Python libraries in Jupyter Notebook allows for more flexibility and creativity in presenting data.
1. Python for data visualization
Python libraries like Matplotlib, Seaborn, and Plotly offer a wide range of options for creating both simple and interactive plots. With Jupyter Notebook, you can execute your Python code and immediately see the results, making it an ideal environment for experimenting with visualizations.
2. R for data visualization
R is renowned for its powerful data visualization libraries like ggplot2 and plotly for R. When using R in Jupyter Notebook, creating rich and complex visualizations becomes straightforward. The ability to combine both R and Python for data visualization in Jupyter Notebook offers unparalleled flexibility.
R and Python for Data Visualization: Jupyter Notebook
While R excels in statistical plots and highly customizable charts, Python provides more interactive and scalable visualizations. By using both R and Python in Jupyter, you can choose the best tool depending on your specific needs.

Sharing Variables Between R and Python in Jupyter Notebook
One of the most powerful features of Jupyter Notebook is its ability to work with both R and Python in a single environment. But how do you share variables between these two languages?
1. Using rpy2
The most common approach to sharing variables between R and Python in Jupyter is using the rpy2 library. This allows you to run R code from within Python and pass variables back and forth seamlessly.
2. Magic commands
Jupyter Notebook offers magic commands like %R for R and %python for Python that enable you to switch between the languages easily. You can use these commands to write your R and Python code in the same notebook and access variables between them.
3. Cross-language workflows
By sharing variables between R and Python in Jupyter, you can create efficient workflows that benefit from the specific strengths of each language. For example, you can clean data using Python’s Pandas library and then use ggplot2 in R for visualization, all within the same notebook.
4. Using IRKernel
IRKernel is an R kernel for Jupyter that allows users to run R code within a Jupyter Notebook. By using this kernel alongside Python, users can share variables and results between the two languages. This method ensures that both R and Python code can coexist and interact within the same notebook.
Practical Example
Here’s a practical example of how to share variables between R and Python in Jupyter Notebook:
- Define a variable in R: Create a variable in an R cell.
- Access the variable in Python: Use rpy2 to access the R variable from a Python cell.
This process demonstrates how users can seamlessly transition data between R and Python, improving the efficiency of their analysis.

On A Final Note…
Jupyter Notebook R and Python integration is a powerful feature that allows data scientists to leverage the strengths of both languages in a single environment. From data visualization with R and Python in Jupyter to sharing variables between R and Python, the platform enables efficient workflows for complex analysis.
The ability to switch between R and Python in a single notebook offers flexibility that few other platforms can match. So, if you’re looking to improve your data analysis capabilities, using R and Python in Jupyter Notebook should definitely be on your list.
Click here to know more.


