


The EM algorithm in machine learning helps find the best parameters for models with hidden data. It does this through simple steps that repeat until the results stabilise. Many data analysts use it for tasks like clustering sales data in e-commerce or fraud patterns in fintech.
This blog explains the EM algorithm in machine learning from basics to advanced use cases. It covers its definition, step-by-step working, a hands-on numerical example, detailed focus on Gaussian mixture models, applications in data analytics, strengths, limitations, and why it matters for data science careers.
What is EM Algorithm in Machine Learning?
People frequently ask: what is EM algorithm in machine learning? It refers to Expectation-Maximization, an iterative technique that finds maximum likelihood estimates when data includes unobserved or latent variables. Developed by Arthur Dempster, Nan Laird, and Donald Rubin in 1977, it tackles scenarios where direct optimisation proves tricky due to missing information.
Imagine you have sales data from multiple customer segments, but you do not know which sale belongs to which segment. EM guesses these assignments probabilistically and refines them over iterations.
As statistician Trevor Hastie puts it in “The Elements of Statistical Learning,” “EM provides a general framework for maximum likelihood estimation in the presence of missing data.” This approach suits data analytics tasks like customer profiling or anomaly detection.
In practice, EM alternates between two phases, making complex problems manageable. It applies widely in unsupervised learning, where labels remain absent.
How the EM Algorithm Works
The beauty of EM lies in its straightforward two-step cycle: Expectation (E) followed by Maximization (M). These steps repeat until the model parameters stabilise, often measured by small changes in log-likelihood.
E-Step: Compute Expectations
During the E-step, you take current parameter guesses and calculate the expected values of the log-likelihood function. This involves treating latent variables as random with known distributions based on observed data. The result forms a lower bound on the true likelihood, known as the Q-function.
For instance, if points arise from unknown clusters, you compute each point’s probability of belonging to every cluster. These probabilities, called responsibilities, guide the next update.
M-Step: Update Parameters
In the M-step, you maximise the Q-function to derive improved parameter estimates, such as means, variances, or mixture weights. For many distributions, this yields closed-form solutions, speeding up computation.
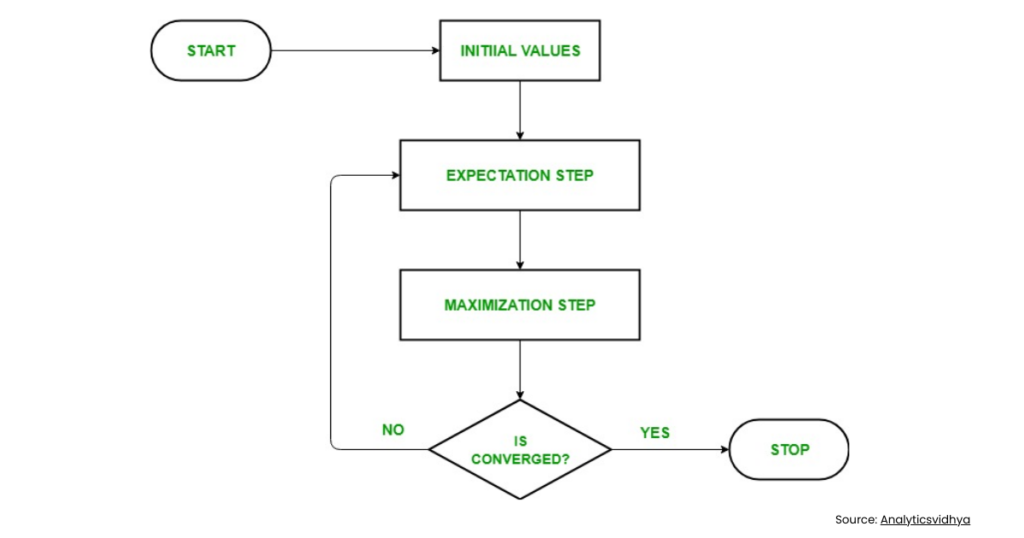
Here is the typical workflow:
- Start with initial parameter values, perhaps from k-means clustering.
- Perform E-step to get responsibilities.
- Execute M-step for parameter updates.
- Check convergence; if not met, loop back.
- Common stop criteria include parameter change below 0.001 or maximum iterations reached.
This process ensures the likelihood never decreases, thanks to mathematical properties like Jensen’s inequality. Have you ever wondered why EM feels intuitive? It mimics human reasoning: guess, then refine based on evidence.
EM Algorithm Numerical Example
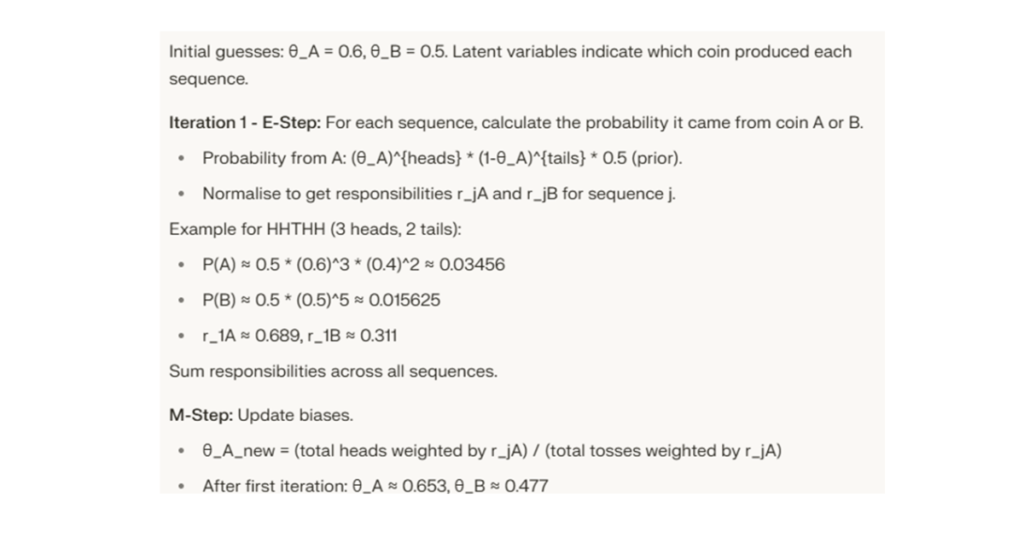
To make concepts concrete, consider an EM algorithm numerical example with coin tosses, a classic yet simple case. Suppose two coins A and B have unknown bias probabilities θ_A and θ_B for heads. You conduct nine experiments, each with 5 tosses from a randomly picked coin, yielding sequences like HHTHH for experiment 1.
EM Algorithm for Gaussian Mixture Model
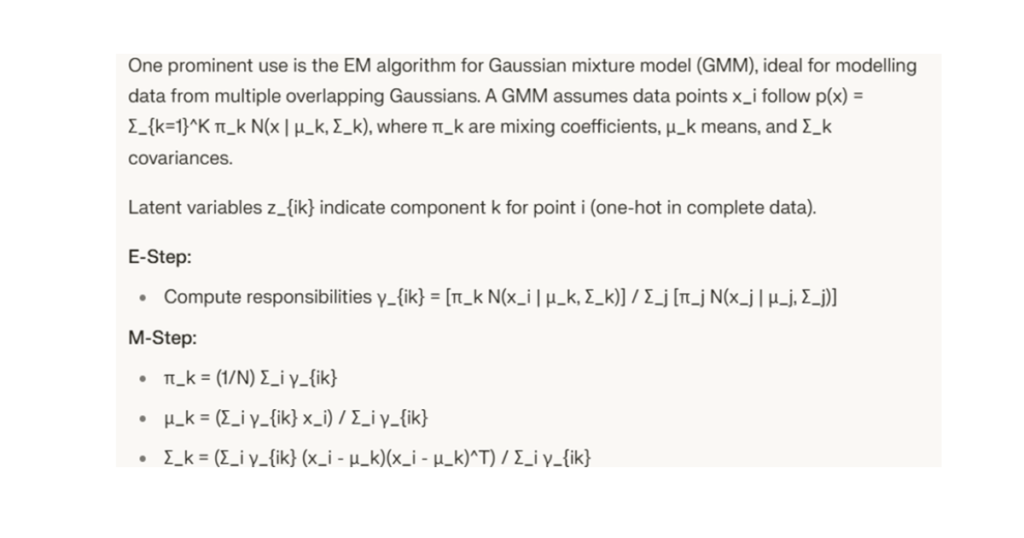
This enables soft clustering, where points partially belong to multiple groups. In data analytics, GMMs excel at density estimation for fraud detection or market segmentation.
Applications of EM Algorithm
The applications of EM algorithm extend across data science domains, powering tools you use daily.
- Customer segmentation in e-commerce analytics, grouping users by behaviour.
- Anomaly detection in network traffic, modelling normal distributions.
- Speech and image recognition via Hidden Markov Models (HMMs), using Baum-Welch (EM variant).
- Natural language processing for topic modelling in LDA.
- Time-series forecasting with missing values in financial data.
Strengths and Limitations
EM offers reliable performance in specific scenarios:
- Naturally manages probabilistic assignments.
- Guarantees likelihood improvement per iteration.
- Scales well with exponential family distributions.
However, challenges exist:
- Results depend heavily on starting parameters; poor initials lead to suboptimal solutions.
- Computationally intensive for very large datasets.
- Prone to local optima rather than global.
Mitigate by multiple random restarts or advanced variants like ECM (Expectation-Conditional Maximization).
On A Final Note…
India’s data analytics market surges, with Bengaluru as a hub. Learning EM equips you for roles involving clustering or probabilistic models at ZELL or similar. It forms the backbone of libraries like scikit-learn, essential for portfolios. Pair it with Python practice to stand out in interviews.
What is EM algorithm in machine learning?
EM, or Expectation-Maximization, iteratively estimates model parameters with latent variables through E (expectation) and M (maximization) steps.
Can you provide an EM algorithm numerical example for beginners?
Yes, the coin toss problem: EM estimates biases from sequences without knowing which coin was used each time, converging via weighted averages.
What are key applications of EM algorithm in data analytics?
Clustering (GMM), HMM training for sequences, missing data imputation, and density estimation in fraud or customer analytics.
How does EM algorithm for Gaussian mixture model differ from k-means?
EM-GMM uses soft probabilistic assignments and models covariance, while k-means does hard partitioning with spherical clusters.
Does EM algorithm always find the global optimum?
No, it reaches local maxima; use good initialization like k-means or run multiple times.