Probability Distributions in Data Science: Ever sat down with a pile of numbers and thought, “How do I even begin to make sense of this?” That’s exactly where probability distributions in data science come to the rescue. They’re the backbone of many statistical methods and machine learning models.
When we talk about probability distributions in data science, we’re essentially trying to answer one simple question: How is data likely to behave? Think of them as maps that describe how values are spread out or how frequently they occur.
As the famous statistician George Box once said, “All models are wrong, but some are useful.”
Probability distributions help us get as close to “useful” as possible.
What is Probability Distribution?
A probability distribution is nothing but a way of describing how probabilities are assigned to different outcomes of a random event.
Here’s a simple example. Suppose you toss a fair coin. The probability of getting heads is 0.5, and tails is 0.5. If you write these probabilities down in a table, you’ve just created a basic probability distribution.
In data science, distributions go far beyond coins and dice. They help us predict how data is spread across different values. This is crucial because without understanding the spread, any analysis or prediction can be misleading.
- t gives us the likelihood of different outcomes.
- It can be discrete (specific values like 1, 2, 3) or continuous (any value in a range, like height or weight).
- It’s the foundation for statistical modelling and machine learning.

Types of Probability Distribution
Now that we know what is probability distribution, let’s look at its major categories.
1. Discrete Probability Distribution
Here, outcomes are countable. For example, the number of times a customer buys something in a week. The probability can be listed clearly for each possible outcome.
Common examples:
- Binomial distribution
- Poisson distribution
2. Continuous Probability Distribution
Here, outcomes can take any value within a range. For example, the height of students in a classroom.
Common examples:
- Normal distribution
- Exponential distribution
So, when people ask, “What’s the difference between the types of probability distribution?” , the answer is: discrete for countable events, continuous for measurable data.
Read More: Top 50 SQL Interview Questions for Data Analyst Roles in 2025
Binomial Distribution in Data Science
The binomial distribution in data science comes into play when we have scenarios with only two possible outcomes; success or failure.
Example: Imagine you’re analysing whether customers will click on an ad (yes or no). If you show the ad to 100 people, binomial distribution helps predict how many are likely to click.
Formula Recap (without going too heavy):
- It uses number of trials (n), probability of success (p), and number of successes (k).
Why it’s useful in data science?
- Customer churn analysis (will a customer stay or leave?)
- Quality control (is a product defective or not?)
- A/B testing (which version performs better?)
As data scientist Sebastian Raschka notes, “Probabilistic thinking is at the heart of modern machine learning.” And the binomial distribution is a shining example of this.

Normal Distribution in Data Science
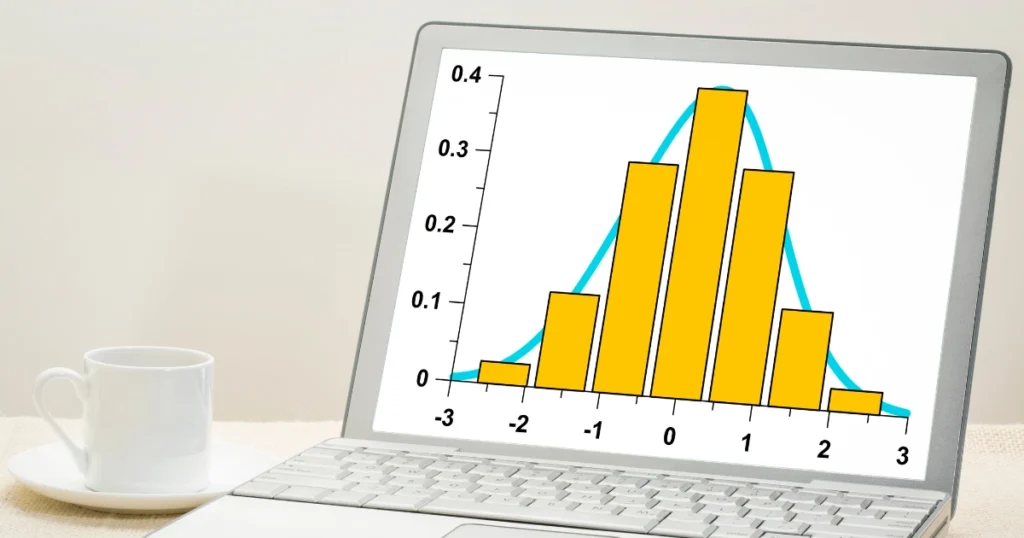
The normal distribution in data science is probably the most famous one. It’s also known as the bell curve because of its shape.
Example: Think about exam scores of a large class. Most students score around the average, with fewer scoring very low or very high. That’s normal distribution in action.
Features:
- Symmetrical around the mean.
- Mean = Median = Mode.
- Used in hypothesis testing, regression, and many machine learning algorithms.
Applications in data science:
- Predicting demand forecasts.
- Analysing customer age groups.
- Standardising datasets for machine learning models.
Fun fact: According to the Central Limit Theorem, when we average many independent observations, the result tends to follow a normal distribution. That’s why it’s everywhere in statistics.
Poisson Distribution in Data Science
Now let’s talk about the Poisson distribution in data science. This one is used when we’re counting how many times an event happens in a fixed interval of time or space.
Example: How many calls does a call centre receive in an hour? Or, how many buses arrive at a station within 10 minutes?
Key points:
- It deals with counts of events.
- Assumes events occur independently.
- Works well for rare events.
Applications:
- Analysing website traffic (visits per minute).
- Predicting number of accidents at a traffic junction.
- Studying system failures in networks.
Quote from statistician William Feller: “The Poisson distribution is the law of small numbers.” That perfectly sums up its role.
Why Probability Distributions Matter in Data Science?
Still wondering why we spend so much time on probability distributions in data science? Let’s put it in perspective:
- They simplify reality: Real-world data is messy. Distributions give it shape.
- They guide decision making: Whether it’s risk assessment or predicting sales.
- They power algorithms: From linear regression to deep learning models, many algorithms rely on assumptions about distributions.
- They improve accuracy: Without understanding data distribution, predictions can be completely off.
Applications in Data Science
Here’s how data scientists actually use these distributions:
- Customer Analytics
- Predicting buying behaviour using binomial distribution.
- Healthcare Data
- Analysing patient recovery times with normal distribution.
- Telecommunication Networks
- Modelling system failures using Poisson distribution.
- E-commerce
- Using distributions to forecast demand during festive sales.
- Machine Learning
- Probability distributions help in Bayesian learning, decision trees, and even deep neural networks.

On A Final Note…
So, if we connect all the dots, probability distributions in data science are more than just statistical theory. They’re practical tools that allow us to understand, model, and predict the behaviour of data.
We walked through what is probability distribution, types of probability distribution, and explored three key ones, binomial distribution in data science, normal distribution in data science, and Poisson distribution in data science. Each has its own charm and real-world use cases.
To put it simply: if data is the raw ingredient, probability distributions are the recipe books that guide us in turning data into meaningful insights.
As statistician John Tukey once said, “The greatest value of a picture is when it forces us to notice what we never expected to see.”
Probability distributions are exactly that “picture” in data science.


