


Types of Regression Analysis: Have you ever wondered how businesses predict next quarter’s sales, or how economists forecast inflation trends? The answer often lies in regression analysis. This powerful statistical method helps researchers, analysts, and data scientists understand relationships between variables and make accurate predictions.
Before go into the types of regression analysis, it’s important to know what is regression analysis. At its core, regression analysis is a method that explains how one variable depends on another. For example, if you want to know how advertising spend impacts sales, regression can help you build that relationship mathematically.
In fact, as the statistician George Box once said, “All models are wrong, but some are useful.” Regression models might not be perfect, but they are incredibly useful in drawing insights and guiding decisions.
So, let’s get started.
What is Regression Analysis?
Regression analysis is a statistical technique used to identify the relationship between a dependent variable (the one you want to predict) and one or more independent variables (the factors influencing it).
For example:
- Predicting house prices based on size, location, and number of bedrooms.
- Estimating crop yield based on rainfall and fertiliser usage.
- Forecasting stock prices using past market behaviour.
Mathematically, regression gives us an equation that helps in prediction. That’s why terms like the simple linear regression equation or multiple linear regression equation are so popular.
But regression isn’t just about prediction, it also tests hypotheses, shows correlations, and allows you to measure the strength of a relationship.
Assumptions of Regression Analysis
Before we apply regression, certain assumptions of regression analysis must hold true. If they don’t, the results may be biased or misleading.
Here are the key ones:
- Linearity: The relationship between dependent and independent variables should be linear.
- Independence: Observations must be independent of each other.
- Homoscedasticity: The variance of error terms should remain constant across values.
- Normality of errors: Residuals (errors) should follow a normal distribution.
- No multicollinearity: Independent variables shouldn’t be highly correlated with each other.
Why do these assumptions matter? Because if they’re violated, advanced methods like ridge and lasso regression or even support vector machine regression might be more reliable than classical methods.
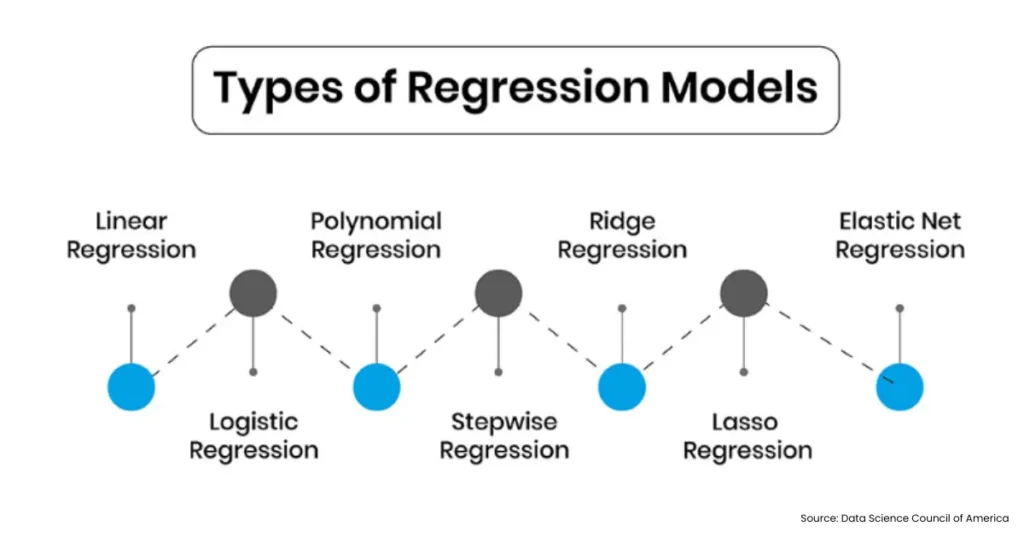
Types of Regression Analysis
Now, let’s explore the types of regression analysis step by step. Each type has its own purpose, strengths, and limitations.
1. Simple Linear Regression
The most basic form is captured in the simple linear regression equation:
Y=a+bX+eWhere:
- Y = Dependent variable
- a = Intercept
- b = Slope (coefficient)
- X = Independent variable
- e = Error term
For instance, predicting sales (Y) based on advertising spend (X). If advertising increases, sales usually rise, and regression helps quantify that change.
This type is easy to use and interpret, but it only works when one independent variable strongly influences the dependent variable.
2. Multiple Linear Regression
When life gets more complicated, we move to the multiple linear regression equation:
Y=a+b1X1+b2X2+…+bnXn+eHere, more than one factor is considered. Imagine predicting salary (Y) based on education level, work experience, and skills. Each independent variable has its own coefficient that explains its contribution.
This is one of the most widely used types of regression analysis in business, economics, and social sciences.
3. Polynomial Regression
Sometimes relationships are not straight lines but curves. That’s where polynomial regression comes in.
Example: predicting population growth where the increase isn’t linear but exponential. By adding squared or cubic terms, polynomial regression captures such trends.
However, it can lead to overfitting if not handled carefully.
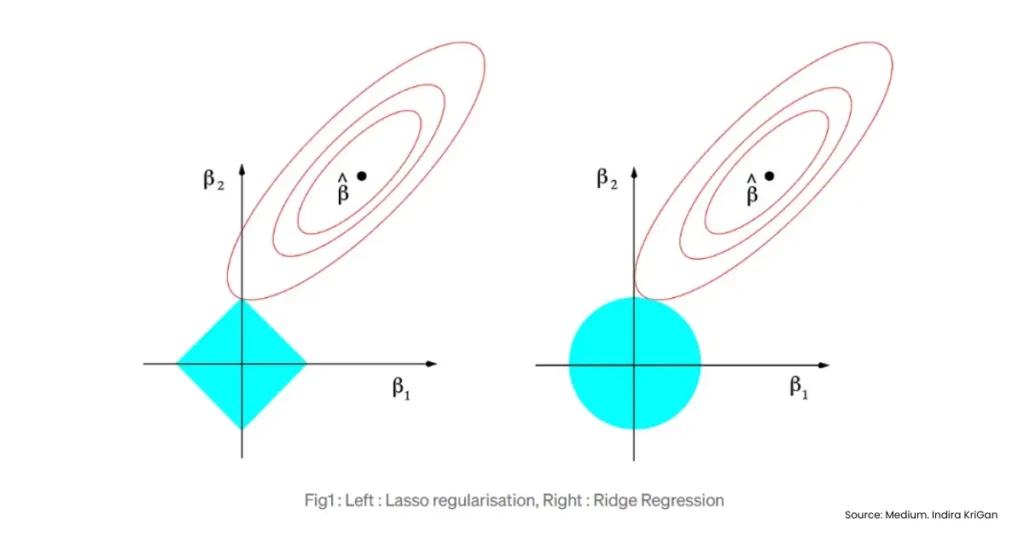
4. Ridge and Lasso Regression
When we deal with multicollinearity or too many independent variables, techniques like ridge and lasso regression save the day.
- Ridge regression: Adds a penalty to large coefficients, shrinking them towards zero but not exactly zero.
- Lasso regression: Goes a step further and can make some coefficients exactly zero, effectively performing variable selection.
These methods are especially common in machine learning when datasets are huge and messy.
5. Logistic Regression
Though technically not linear regression, logistic regression is widely used when the dependent variable is categorical.
For example, predicting whether a student passes or fails based on study hours and attendance. Instead of giving a continuous number, it outputs probabilities.
This is one of the types of regression analysis commonly used in health sciences, finance (fraud detection), and marketing (customer churn prediction).
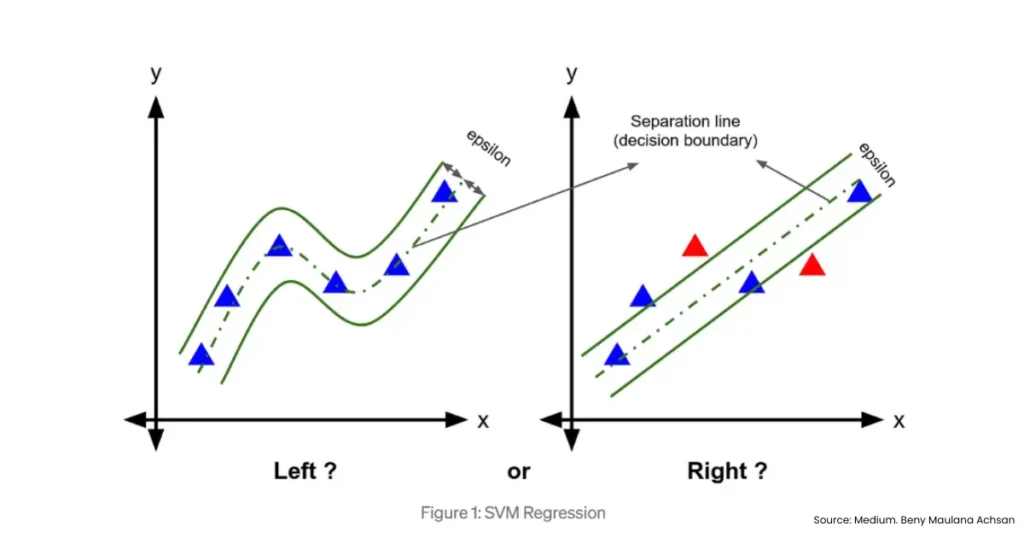
6. Support Vector Machine Regression
Support vector machine regression (also called SVR) is a more advanced technique from machine learning. Instead of fitting a line, it tries to fit a boundary that allows errors only within a certain margin.
It’s particularly useful when:
- The data is high-dimensional.
- The relationship between variables isn’t strictly linear.
- Outliers are present.
Applications include predicting stock market returns, demand forecasting, and analysing medical data.
7. Stepwise Regression
This method automatically adds or removes variables based on statistical significance. It’s handy when you’re unsure which variables matter most.
8. Quantile Regression
Unlike classical regression that estimates the mean, quantile regression focuses on medians or other quantiles. It’s useful when data is skewed or when extreme values matter.
9. Elastic Net Regression
This is a mix of ridge and lasso regression. It’s particularly helpful when there are many correlated predictors.
Read More: Clustering Algorithms in Machine Learning: Types, Comparison & Accuracy
Application of Regression Analysis
So, where do we actually use regression? The truth is, regression analysis is everywhere, from the stock markets to the doctor’s clinic. Let’s look at some practical areas where it plays a big role.
1. Economics and Finance
Economists often rely on the multiple linear regression equation to analyse how several factors affect economic indicators. For example:
- Estimating the impact of interest rates on investment: Here, investment (dependent variable) is predicted based on interest rates, inflation, and savings rates (independent variables).
- Forecasting GDP growth: Using past GDP, inflation rates, and employment figures, a regression model can project the next quarter’s growth.
In finance, ridge and lasso regression are widely used for stock market modelling where hundreds of variables may influence prices. Even support vector machine regression comes into play when predicting stock returns with large, complex datasets.
2. Healthcare and Medicine
Healthcare generates massive amounts of data, and regression helps make sense of it. For example:
- Predicting patient recovery times: Using data on age, type of treatment, and medical history, hospitals can predict recovery length with a simple linear regression equation or, in complex cases, a multiple linear regression equation.
- Analysing treatment effectiveness: Logistic regression helps in classifying whether a treatment leads to recovery or not.
- Forecasting disease outbreaks: Regression models have been used to estimate the spread of diseases like COVID-19 based on population density and mobility patterns.
In fact, a WHO report noted that predictive modelling, including regression, was key in tracking and responding to global health emergencies.
3. Marketing and Business Analytics
Marketers love regression because it directly links actions to outcomes. Some examples include:
- Measuring the effect of promotional campaigns on sales: By running regression with advertising spend, social media activity, and discount offers as independent variables, businesses can see which factor drives the most sales.
- Customer lifetime value (CLV) prediction: Using multiple linear regression equation, companies predict how much a customer will spend in the future.
- Price elasticity studies: Regression helps firms know how much a change in price affects demand.
Advanced methods like ridge and lasso regression are often used in digital marketing, where hundreds of variables (keywords, ad spend, audience demographics) come into play.

4. Sports Analytics
From cricket to football, regression is used to track performance and forecast outcomes.
- Analysing player performance: A simple linear regression equation can predict runs scored based on number of balls faced.
- Team performance: A multiple linear regression equation can combine player stats, weather conditions, and venue data to forecast match outcomes.
- Injury prediction: Regression helps teams monitor workload and training data to estimate the likelihood of injuries.
Even in fantasy sports, regression is used behind the scenes to assign player points and predict probable match winners.
5. Agriculture and Environmental Studies
Farmers and scientists alike use regression to tackle uncertainty in agriculture.
- Forecasting crop yields: By analysing rainfall, fertiliser use, temperature, and soil quality, regression helps farmers estimate expected yield.
- Predicting pest outbreaks: Regression models can relate weather data with pest infestations, helping farmers take preventive measures.
- Environmental forecasting: Support vector machine regression is often applied to predict air pollution levels or temperature changes over time.
For example, the Indian Council of Agricultural Research (ICAR) uses regression-based forecasting to predict wheat and rice production across different states.
Challenges in Using Regression
While the types of regression analysis are powerful, they aren’t foolproof. Challenges include:
- Violating the assumptions of regression analysis.
- Overfitting with complex models.
- Interpreting coefficients incorrectly.
- Handling categorical data in linear models.
That’s why analysts often compare multiple models, say, the simple linear regression equation against the ridge and lasso regression, before deciding which works best.
On A Final Note…
By now, you should have a solid understanding of:
- What is regression analysis
- The assumptions of regression analysis
- Major types of regression analysis from basic (simple, multiple) to advanced (ridge, lasso, support vector machine regression)
- Application of regression analysis across industries
Regression is not just a mathematical tool, it’s a bridge between data and decision-making. Whether you’re using the multiple linear regression equation for salary prediction, or support vector machine regression for stock market forecasting, the method you choose depends on your problem, data, and goals.
As the data scientist John Tukey once said, “The best thing about being a statistician is that you get to play in everyone’s backyard.” Regression analysis is that very playground, cutting across domains and industries.
FAQs on Types of Regression Analysis
Q1. What is regression analysis in simple terms?
Regression analysis is a statistical method to study the relationship between a dependent variable and one or more independent variables.
Q2. What are the assumptions of regression analysis?
Linearity, independence, homoscedasticity, normality of errors, and no multicollinearity.
Q3. What is the difference between the simple linear regression equation and the multiple linear regression equation?
Simple linear regression uses one independent variable, while multiple regression uses two or more.
Q4. Why use ridge and lasso regression?
They handle multicollinearity, reduce overfitting, and improve model accuracy.
Q5. Where is support vector machine regression used?
It’s used in machine learning problems like stock market predictions, medical data analysis, and forecasting.